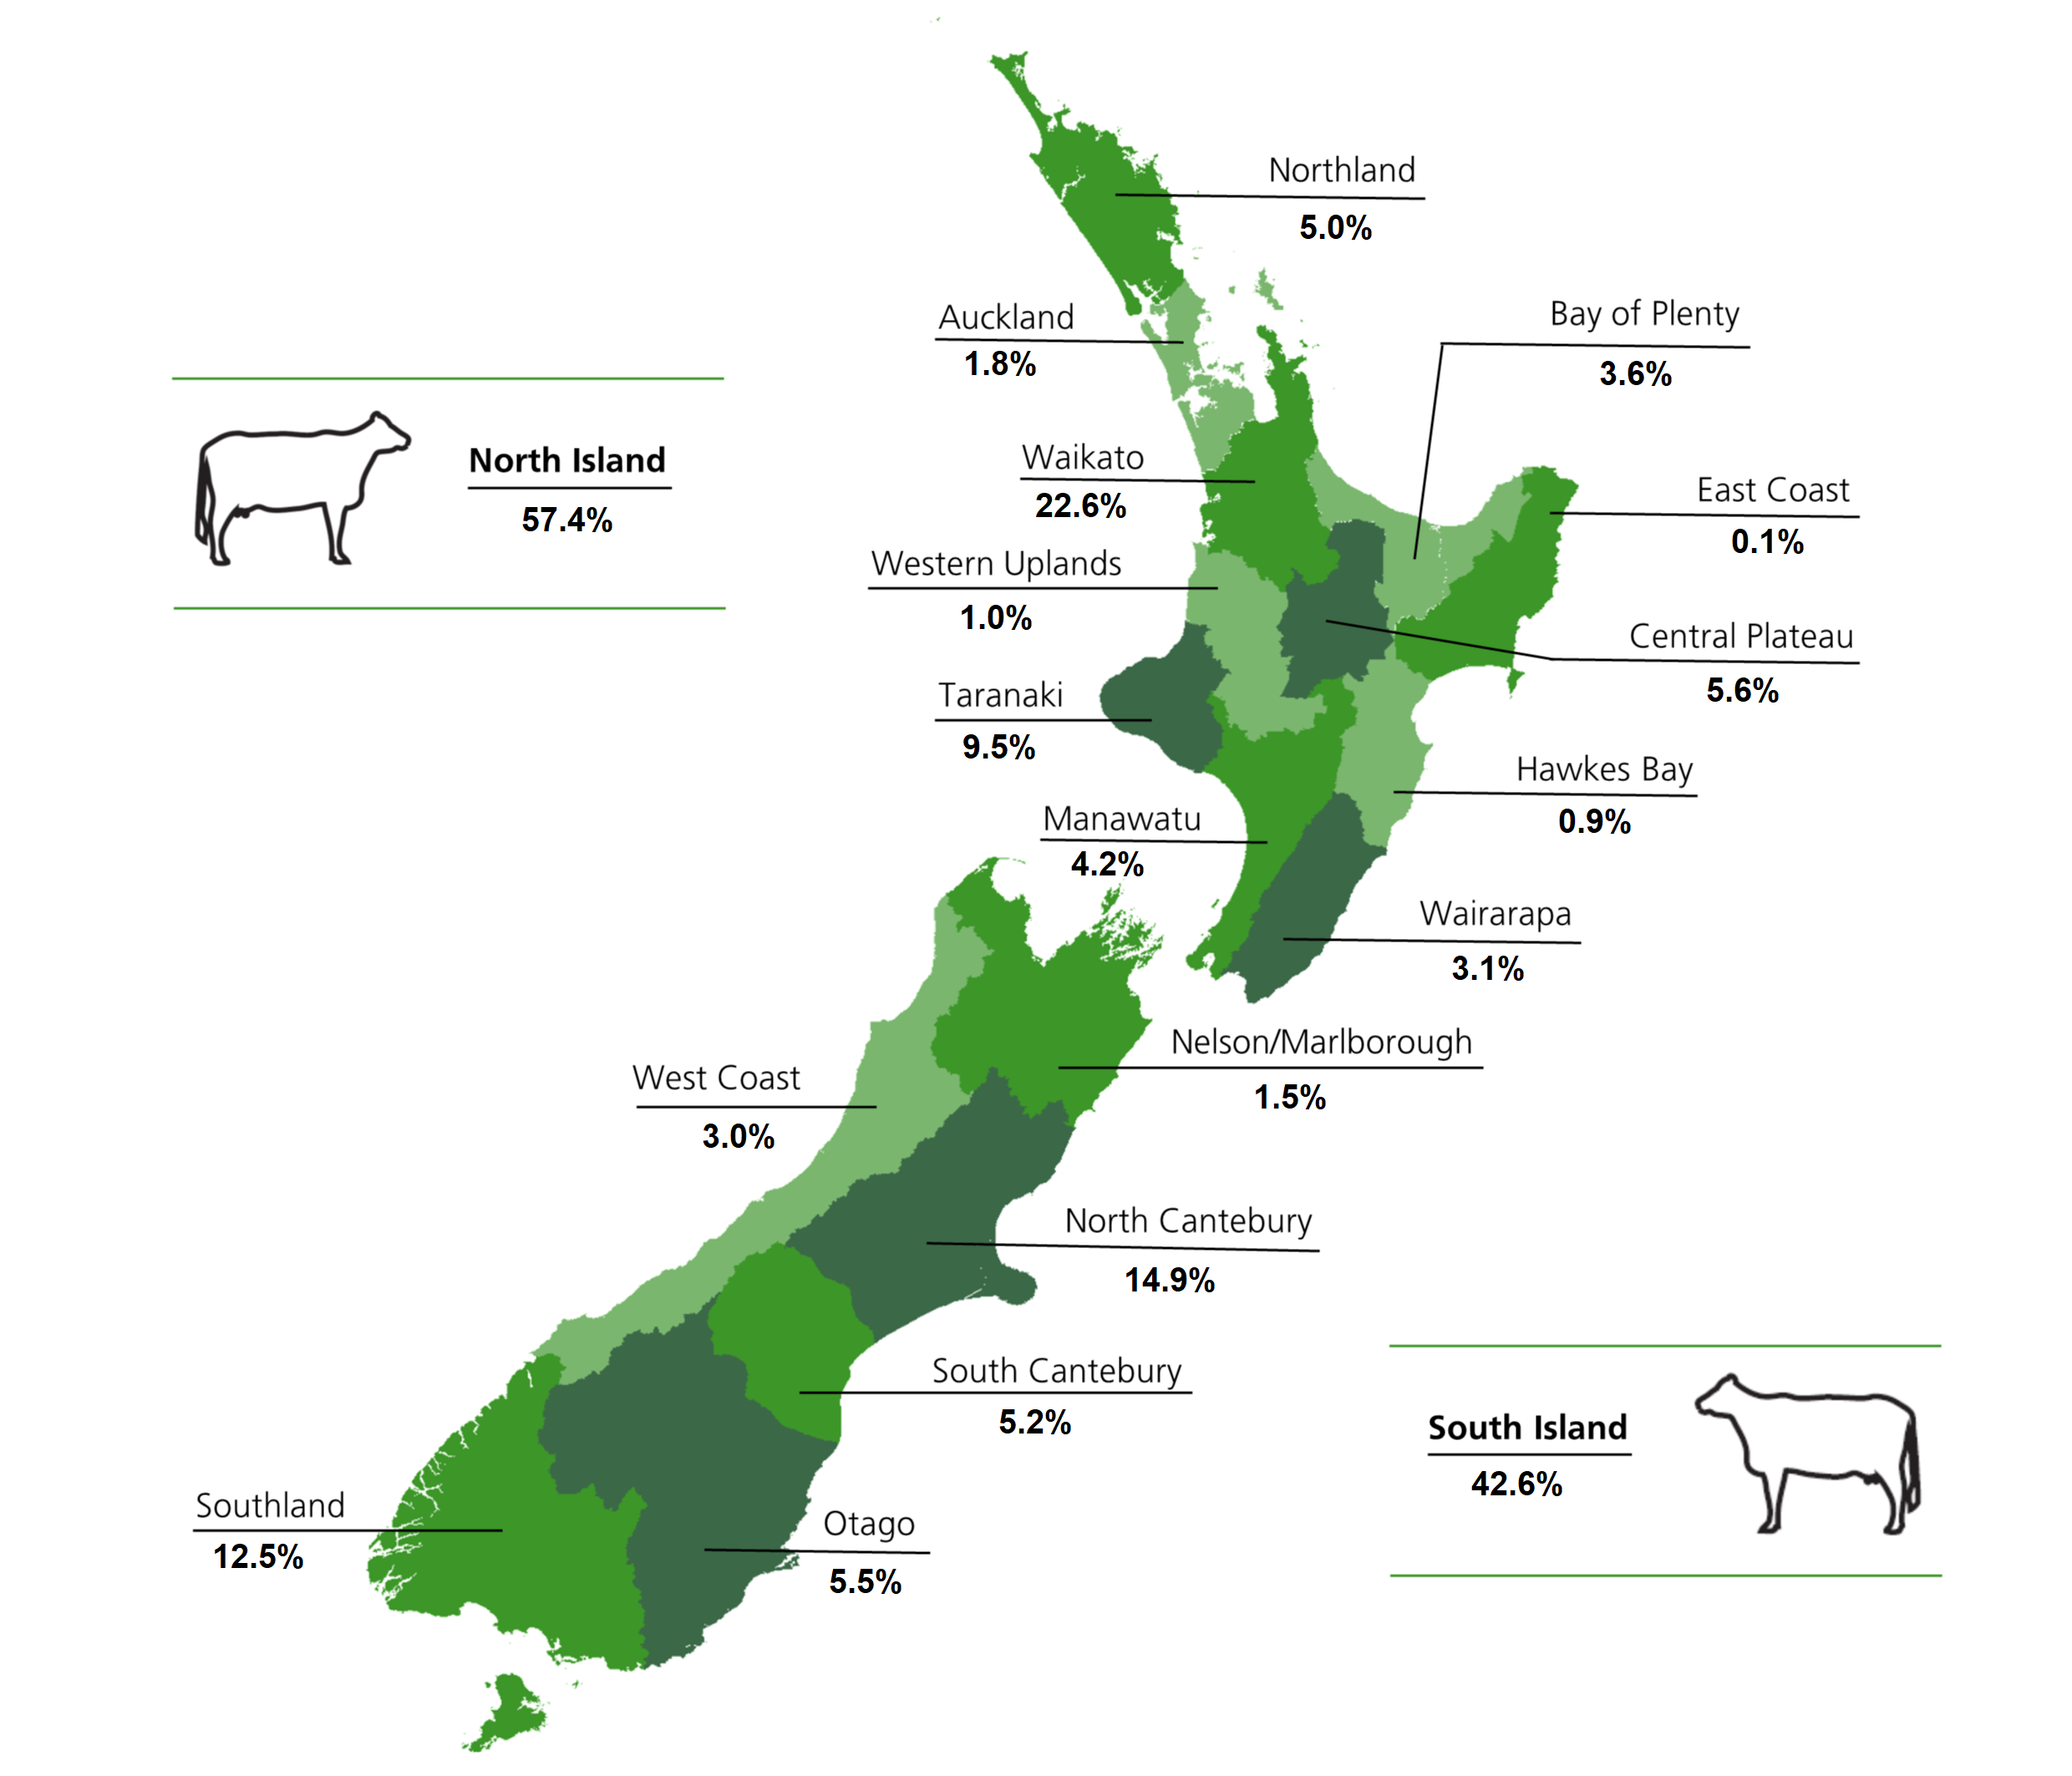
70.2% of dairy herds are located in the North Island
42.6% of dairy cows are located in the South Island
The majority of dairy herds (70.2%) are located in the North Island, with the greatest concentration (28.5%) situated in the Waikato region (Table 3.1). Taranaki is the second largest dairy region (with 14% of dairy herds), followed by Southland (with 9.3% of dairy herds).
Although South Island dairy herds account for 29.8% of the national total, they contain 42.6% of all cows milked (Graph 3.1) as South Island dairy herds are larger than North Island dairy herds (Table 3.1). The Waikato region has the highest share of all dairy cows with 22.6%, followed by North Canterbury (14.9%), Southland (12.5%) and Taranaki (9.5%).
Graph 3.1: Regional distribution of dairy cows in 2022/23
Largest average herd size (792) in North Canterbury
Farms in the South Island are, on average, larger than those in the North Island (both in terms of farm area and cow numbers, see Table 3.1). This season the average herd size increased in the North Island, and decreased in the South Island. Within the South Island, North Canterbury has the largest average herd size (792 cows). In the North Island, Hawkes
Bay has the largest average herd size of 660 cows. The smallest average herd sizes remain in Auckland, Taranaki, and Northland, averaging 283, 301 and 328 cows, respectively. North and South Canterbury have the highest average cows per hectare of 3.47 and 3.26 respectively, both of which are marginal reductions relative to the previous season. The regions with the lowest average cows per hectare are the West Coast (2.21) and Northland (2.24).
Table 3.1: Herd analysis by region in 2022/23
Region
Total herds
Percentage of herds
Total cows
Percentage of cows
Total effective hectares
Percentage of effective hectares
Average herd size
Average effective hectares
Average cows per hectare
Northland
705
6.7
231,402
5.0
103,517
6.2
328
147
2.24
Auckland
301
2.8
85,240
1.8
35,310
2.1
283
117
2.41
Waikato
3,020
28.5
1,057,651
22.6
362,204
21.8
350
120
2.92
Bay of Plenty
476
4.5
167,599
3.6
59,057
3.6
352
124
2.84
Central Plateau
456
4.3
262,767
5.6
97,870
5.9
576
215
2.68
Western Uplands
85
0.8
45,228
1.0
17,778
1.1
532
209
2.54
East Coast
9
0.1
5,086
0.1
2,097
0.1
565
233
2.43
Hawkes Bay
64
0.6
42,217
0.9
14,715
0.9
660
230
2.87
Taranaki
1,479
14.0
445,508
9.5
160,864
9.7
301
109
2.77
Manawatu
482
4.5
197,251
4.2
78,048
4.7
409
162
2.53
Wairarapa
367
3.5
142,890
3.1
52,583
3.2
389
143
2.72
North Island
7,444
70.2
2,682,839
57.4
984,043
59.3
432
164
2.62
Nelson / Marlborough
190
1.8
70,976
1.5
26,467
1.6
374
139
2.68
West Coast
351
3.3
139,137
3.0
63,028
3.8
396
180
2.21
North Canterbury
880
8.3
697,292
14.9
200,849
12.1
792
228
3.47
South Canterbury
313
3.0
243,235
5.2
74,602
4.5
777
238
3.26
Otago
437
4.1
257,577
5.5
90,164
5.4
589
206
2.86
Southland
986
9.3
583,694
12.5
220,277
13.3
592
223
2.65
South Island
3,157
29.8
1,991,911
42.6
675,387
40.7
587
203
2.90
New Zealand
10,601
4,674,750
1,659,430
486
178
2.73
Highest average production per herd for the season was recorded in North Canterbury
North Canterbury had the highest average herd production (343,077 kilograms of milksolids) in the South Island and New Zealand, which was approximately the same as last season (Table 3.2). In order to maintain this level of production despite decreasing average herd size production per cow rose to 434 kilograms of milksolids per cow. In the North Island, Hawkes Bay recorded the highest average herd production of 251,496 kilograms of milksolids, reflecting large herd sizes.
In 2022/23, average production per effective hectare and production per cow was higher in the South Island than in the North Island.In the South Island, North Canterbury recorded the highest average milksolids per hectare (1,503 kg MS/ha) for the 16th season in a row. In the North Island, Waikato had the highest average milksolids production per hectare (1,139 kg MS/ha).
In the South Island, Southland had the highest average milksolids per cow (460 kg MS/cow), and in the North Island, Manawatu had the highest average milksolids per cow (409 kg MS/cow).
Table 3.2: Herd production analysis by region in 2022/23
Region
Total kg milk solids
Percent milk solids
Average litres per herd
Average kg milkfat per herd
Average kg protein per herd
Average kg milk solids per herd
Average kg milkfat per effective hectare
Average kg protein per effective hectare
Average kg milk solids per effective hectare
Average kg milkfat per cow
Average kg protein per cow
Average kg milk solids per cow
Northland
73,744,740
3.9
1,164,669
59,000
45,602
104,602
402
311
712
175
135
309
Auckland
31,752,549
1.7
1,190,527
59,295
46,195
105,490
505
394
899
205
160
365
Waikato
412,514,347
22.0
1,521,501
76,804
59,791
136,594
640
499
1,139
219
170
389
Bay of Plenty
57,123,892
3.0
1,339,585
67,926
52,082
120,008
547
420
967
193
148
341
Central Plateau
99,848,637
5.3
2,446,310
123,152
95,815
218,966
574
446
1,020
223
173
396
Western Uplands
14,155,791
0.8
1,816,289
93,915
72,624
166,539
449
347
796
183
141
323
East Coast
1,509,543
0.1
1,811,258
94,340
73,386
167,727
405
315
720
162
126
288
Hawkes Bay
16,095,716
0.9
2,802,383
140,030
111,465
251,496
609
485
1,094
208
164
372
Taranaki
181,286,223
9.7
1,337,134
68,966
53,607
122,574
634
493
1,127
227
176
403
Manawatu
80,227,305
4.3
1,884,935
92,848
73,599
166,447
573
455
1,028
228
181
409
Wairarapa
52,240,024
2.8
1,566,367
80,021
62,323
142,343
559
435
993
204
159
363
North Island
1,020,498,767
54.5
1,716,451
86,936
67,863
154,799
536
418
954
202
158
360
Nelson / Marlborough
25,737,813
1.4
1,482,743
76,318
59,144
135,462
548
425
972
203
156
359
West Coast
46,916,977
2.5
1,442,164
75,306
58,360
133,667
419
325
744
194
149
343
North Canterbury
301,907,445
16.1
3,783,877
190,941
152,135
343,077
837
667
1,503
242
193
434
South Canterbury
103,055,172
5.5
3,615,157
183,492
145,758
329,250
770
612
1,381
240
190
430
Otago
109,544,664
5.8
2,755,634
139,649
111,026
250,674
677
538
1,215
236
188
424
Southland
265,360,093
14.2
2,950,763
150,020
119,108
269,128
672
533
1,205
256
203
460
South Island
852,522,166
45.5
2,671,723
135,954
107,589
243,543
654
516
1,170
228
180
408
New Zealand
1,873,020,932
100.0
2,053,606
104,237
81,884
186,120
578
453
1,030
211
165
377
3.2 Districts
South Taranaki continues to be the district with the highest number of herds (901) followed by Matamata-Piako (815) (Table 3.3), while the Southland district continues to have the most cows (436,181), followed by Ashburton (352,439). Mackenzie district in South Canterbury has the highest average herd size for the fourth season in a row with 1,102 cows, followed by Ashburton in North Canterbury with 843 cows. The number of owner-operators and sharemilkers is included in Table 3.3. Fifty-six percent of herds are run by owner-operators, while 29.2% of herds are operated by sharemilkers of various types (Table 3.5). The remainder (19.3%) are largely herds with contract milkers.
Table 3.3: Herd analysis by district in 2022/23
Region
District
Total herds
Number of owner operators
Number of contract milkers
Number of share milkers
Total cows
Total effective hectares
Average herd size
Average effective hectares
Average cows per hectare
Northland
Far North
196
128
19
45
63,166
28,328
322
145
2.23
Whangarei
245
139
30
71
81,374
35,416
332
145
2.30
Kaipara
264
175
31
55
86,863
39,772
329
151
2.18
Auckland
Rodney / Auckland
115
66
17
32
32,801
13,941
285
121
2.35
Manukau / Papakura
8
5
0
3
2,586
1,176
323
147
2.20
Franklin
178
90
18
69
49,853
20,193
280
113
2.47
Waikato
Waikato
595
313
79
197
206,703
73,230
347
123
2.82
Hamilton City
16
8
1
7
4,509
1,535
282
96
2.94
Waipa
493
250
93
145
183,722
61,512
373
125
2.99
Otorohanga
331
173
43
113
124,266
43,356
375
131
2.87
Thames-Coromandel
73
43
18
12
22,524
8,530
309
117
2.64
Hauraki
337
169
69
97
103,339
36,972
307
110
2.80
Matamata-Piako
815
384
103
316
261,142
84,516
320
104
3.09
South Waikato
360
172
80
106
151,447
52,552
421
146
2.88
Bay of Plenty
Western Bay of Plenty
158
86
33
37
57,486
19,667
364
124
2.92
Tauranga
10
5
2
3
4,577
1,607
458
161
2.85
Kawerau / Whakatane
245
147
33
61
85,048
30,173
347
123
2.82
Opotiki
63
32
4
26
20,488
7,610
325
121
2.69
Central Plateau
Taupo
169
114
23
32
133,846
50,126
792
297
2.67
Rotorua
287
158
45
83
128,921
47,744
449
166
2.70
Western Uplands
Waitomo
59
30
7
22
32,311
12,533
548
212
2.58
Ruapehu
26
14
2
10
12,917
5,245
497
202
2.46
East Coast
Gisborne / Wairoa
9
6
2
1
5,086
2,097
565
233
2.43
Hawkes Bay
Napier / Hastings
26
18
3
5
15,356
5,736
591
221
2.68
Central Hawkes Bay
38
30
3
5
26,861
8,979
707
236
2.99
Taranaki
New Plymouth
364
205
42
117
99,802
38,598
274
106
2.59
Stratford
214
137
23
54
56,010
21,084
262
99
2.66
South Taranaki
901
478
140
282
289,696
101,182
322
112
2.86
Manawatu
Wanganui
19
14
1
4
7,708
3,797
406
200
2.03
Rangitikei
78
52
13
13
37,602
14,495
482
186
2.59
Manawatu
223
144
27
52
87,126
34,641
391
155
2.52
Palmerston North City
43
30
7
6
19,979
7,653
465
178
2.61
Horowhenua
106
73
11
22
40,684
15,683
384
148
2.59
Kapiti Coast / Upper Hutt
13
7
2
4
4,152
1,779
319
137
2.33
Wairarapa
Tararua
242
143
35
64
84,895
32,537
351
134
2.61
Masterton
14
5
3
5
7,633
2,629
545
188
2.90
Carterton
45
35
6
4
17,864
6,319
397
140
2.83
South Wairarapa
66
32
21
13
32,498
11,098
492
168
2.93
North Island
7,444
4,110
1,089
2,193
2,682,839
984,043
404
153
2.64
Nelson / Marlborough
Marlborough
44
33
3
8
15,330
5,541
348
126
2.77
Kaikoura
20
11
0
9
8,582
2,806
429
140
3.06
Tasman/Nelson City
126
90
14
22
47,064
18,120
374
144
2.60
West Coast
Buller
114
85
5
24
44,360
19,051
389
167
2.33
Grey
93
66
7
20
42,017
18,679
452
201
2.25
Westland
144
110
6
28
52,760
25,298
366
176
2.09
North Canterbury
Hurunui
95
52
23
20
77,738
23,773
818
250
3.27
Waimakariri
99
54
10
34
66,644
20,355
673
206
3.27
Christchurch City
36
18
7
11
28,667
9,025
796
251
3.18
Banks Peninsula
6
3
0
3
2,079
752
346
125
2.76
Selwyn
226
159
18
49
169,725
48,520
751
215
3.50
Ashburton
418
224
52
140
352,439
98,424
843
235
3.58
South Canterbury
Timaru
177
121
10
46
125,744
37,492
710
212
3.35
Mackenzie
16
6
2
8
17,628
5,932
1,102
371
2.97
Waimate
120
64
6
50
99,863
31,178
832
260
3.20
Otago
Waitaki
153
68
14
63
101,909
31,040
666
203
3.28
Dunedin City
62
35
2
22
28,184
9,726
455
157
2.90
Clutha
188
110
18
52
100,609
38,294
535
204
2.63
Central Otago / Lakes
34
24
5
4
26,874
11,104
790
327
2.42
Southland
Gore
161
90
21
44
89,640
34,901
557
217
2.57
Invercargill
101
51
17
29
57,873
22,070
573
219
2.62
Southland
724
375
100
221
436,181
163,305
602
226
2.67
South Island
3,157
1,849
340
907
1,991,911
675,387
610
210
2.90
New Zealand
10,601
5,959
1,429
3,100
4,674,750
1,659,430
507
182
2.79
Nationally, Mackenzie district had the highest average production per herd again with 410,427 kilograms of milksolids followed by Hurunui with 370,921 kilograms of milksolids (Table 3.4). Ashburton had the highest average milksolids per effective hectare with 1,563 kilograms, while Hurunui had the second highest (1,482 kilograms per hectare). Southland also recorded the highest average production per cow (466 kilograms of milksolids) followed by Invercargill district (456 kilograms of milksolids). Within the North Island districts, Taupo had the highest milksolids production per herd with an average of 289,912 kilograms of milksolids, followed by Central Hawkes Bay with 286,348 kilograms. Of all the North Island districts, Masterton and Matamata-Piako again produced the highest average kilograms of milksolids per hectare (1,235 and 1,221 respectively), while South Waikato district produced the highest average kilograms of milksolids per cow (418).
Table 3.4: Herd production analysis by district in 2022/23
Region
District
Average litres per herd
Average kg milkfat per herd
Average kg protein per herd
Average kg milk solids per herd
Average kg milkfat per effective hectare
Average kg protein per effective hectare
Average kg milk solids per effective hectare
Average kg milkfat per cow
Average kg protein per cow
Average kg milk solids per cow
Northland
Far North
1,165,507
58,665
45,514
104,179
406
315
721
172
133
305
Whangarei
1,212,853
61,566
47,429
108,995
426
328
754
181
139
319
Kaipara
1,119,332
56,867
43,973
100,841
377
292
669
171
132
303
Auckland
Rodney / Auckland
1,096,742
56,225
42,977
99,201
464
355
818
191
146
337
Manukau / Papakura
1,259,051
61,572
49,356
110,927
419
336
755
204
162
366
Franklin
1,248,039
61,177
48,132
109,309
539
424
964
214
169
383
Waikato
Waikato
1,465,133
73,525
57,093
130,617
597
464
1,061
210
163
372
Hamilton City
1,170,305
60,055
45,820
105,874
626
478
1,104
211
161
373
Waipa
1,667,245
83,939
65,454
149,393
673
525
1,197
225
176
401
Otorohanga
1,577,933
80,072
62,285
142,357
611
476
1,087
216
168
384
Thames-Coromandel
1,145,175
58,346
45,162
103,508
499
386
886
188
146
334
Hauraki
1,242,248
62,744
48,953
111,696
572
446
1,018
209
163
372
Matamata-Piako
1,402,179
71,306
55,279
126,584
688
533
1,221
223
173
395
South Waikato
1,986,650
99,542
78,148
177,690
682
535
1,217
234
184
418
Bay of Plenty
Western Bay of Plenty
1,303,610
66,870
51,142
118,012
537
411
948
187
143
329
Tauranga
1,515,515
81,048
61,171
142,219
504
381
885
190
142
332
Kawerau / Whakatane
1,421,908
71,625
54,954
126,579
582
446
1,028
204
156
360
Opotiki
1,081,738
54,108
41,828
95,936
448
346
794
166
128
293
Central Plateau
Taupo
3,228,920
162,927
126,985
289,912
549
428
977
212
166
378
Rotorua
1,985,469
99,730
77,460
177,190
599
466
1,065
229
178
407
Western Uplands
Waitomo
1,831,712
94,964
73,487
168,452
447
346
793
181
140
321
Ruapehu
1,781,290
91,533
70,664
162,197
454
350
804
185
142
328
East Coast
Gisborne / Wairoa
1,811,258
94,340
73,386
167,727
405
315
720
162
126
288
Hawkes Bay
Napier / Hastings
2,213,479
112,703
87,854
200,557
511
398
909
188
146
334
Central Hawkes Bay
3,205,317
158,728
127,621
286,348
672
540
1,212
221
177
398
Taranaki
New Plymouth
1,152,037
59,915
46,004
105,919
565
434
999
214
165
379
Stratford
1,112,081
56,717
44,096
100,813
576
448
1,023
218
169
387
South Taranaki
1,465,365
75,533
58,938
134,470
673
525
1,197
234
182
417
Manawatu
Wanganui
1,608,192
77,382
62,496
139,879
387
313
700
199
159
359
Rangitikei
2,080,668
103,168
81,805
184,973
555
440
995
231
182
413
Manawatu
1,812,643
89,546
70,902
160,448
576
456
1,033
229
182
411
Palmerston North City
2,285,427
113,202
89,057
202,259
636
500
1,136
233
182
415
Horowhenua
1,832,673
89,564
71,015
160,580
605
480
1,085
229
181
411
Kapiti Coast / Upper Hutt
1,456,507
69,619
56,777
126,396
509
415
924
213
173
386
Wairarapa
Tararua
1,394,018
71,641
55,663
127,303
533
414
947
204
158
362
Masterton
2,634,219
129,164
102,777
231,941
688
547
1,235
232
183
415
Carterton
1,707,492
85,398
66,640
152,037
608
475
1,083
210
163
373
South Wairarapa
1,875,576
96,657
75,217
171,875
575
447
1,022
196
152
348
North Island
1,646,198
82,939
64,829
147,768
547
427
973
206
160
366
Nelson / Marlborough
Marlborough
1,559,821
78,067
60,968
139,034
620
484
1,104
215
168
383
Kaikoura
1,974,160
101,760
78,699
180,459
725
561
1,286
231
180
411
Tasman/Nelson City
1,377,824
71,669
55,404
127,072
498
385
884
193
149
342
West Coast
Buller
1,403,725
72,622
56,353
128,976
435
337
772
194
149
343
Grey
1,640,010
84,736
66,157
150,892
422
329
751
185
144
329
Westland
1,344,820
71,341
54,914
126,255
406
313
719
199
153
352
North Canterbury
Hurunui
4,081,445
207,853
163,068
370,921
831
652
1,482
253
198
451
Waimakariri
3,401,104
166,867
134,137
301,004
812
652
1,464
246
198
444
Christchurch City
3,770,987
191,181
153,449
344,629
763
612
1,375
243
194
437
Banks Peninsula
1,553,494
83,426
62,928
146,354
666
502
1,168
189
148
337
Selwyn
3,396,577
171,830
136,657
308,487
800
637
1,437
231
184
415
Ashburton
4,049,430
204,655
163,449
368,105
869
694
1,563
244
195
440
South Canterbury
Timaru
3,385,919
170,820
135,775
306,595
806
641
1,447
242
192
435
Mackenzie
4,548,558
227,267
183,159
410,427
613
494
1,107
217
175
392
Waimate
3,828,830
196,346
155,496
351,842
756
598
1,354
239
189
429
Otago
Waitaki
3,150,958
161,579
128,121
289,701
796
632
1,428
244
193
437
Dunedin City
2,183,856
109,438
87,191
196,629
698
556
1,253
238
191
429
Clutha
2,463,148
123,048
98,224
221,272
604
482
1,086
229
183
411
Central Otago / Lakes
3,636,601
187,846
148,342
336,188
575
454
1,029
239
190
429
Southland
Gore
2,635,666
134,055
105,830
239,886
618
488
1,107
242
191
433
Invercargill
2,886,002
145,781
115,793
261,574
667
530
1,197
254
202
456
Southland
3,029,867
154,161
122,523
276,684
683
543
1,227
260
206
466
South Island
2,786,491
141,652
112,120
253,772
667
526
1,193
229
181
409
New Zealand
2,216,344
112,296
88,475
200,770
607
476
1,083
217
170
388
Note: Districts with fewer than four herds have been added to a neighbouring district to preserve anonymity
3.3 Operating structures
The main operating structures found on New Zealand dairy farms are owner operator, sharemilker and contract milker.
Owner operators are farmers who own and operate their own farms, or who employ a manager to operate the farm for a fixed wage.
Owner-operators receive all the farm income, although they may pay wages. Owner operators comprise the largest group of all
operating structures, being 56% of all herds.
Contract milkers (13.5% of herds) are contracted to milk a herd at a set price per kilogram of milksolids produced. The rate is set in part according to the amount of farm work done.
Sharemilking has traditionally been the first step to farm ownership. Sharemilking involves operating a farm on behalf of the farm owner for an agreed share of the farm receipts (as opposed to a set wage). Two types of sharemilking agreement are commonly used: Variable order sharemilking and herd-owning sharemilking agreements.
Herd-owning sharemilkers (also called 50/50 sharemilkers) own the herd and generally any equipment (other than the milking plant) needed to farm the
property. The sharemilker is usually responsible for milk harvesting expenses, labour, stock-related expenses, and general farm work. The owner is usually responsible for expenses related to maintaining the property. The percentage quoted in a 50/50 sharemilking agreement usually refers to the proportion of milk income the sharemilker receives. While this percentage is most commonly 50%, it can range from 45% to 55%. Under the 50/50 agreement the sharemilker receives the agreed percentage of milk income plus the majority of income from stock sales, and the farm owner receives the remaining percentage of milk income.
Unlike the 50/50 agreement, where the owner may have little to do with farm management, a variable-order sharemilking agreement often sees the owner retain some involvement in management of the farm. The variable-order sharemilking agreement involves the farm owner retaining ownership of the herd and bearing more of the farm costs, such as animal health and breeding. The amount of farm work required by the sharemilker is determined by the individual agreement, with responsibility ranging from herd management only to carrying out all farm work.
The “Other/Unknown” category includes herds with unknown operating structure or herds with characteristics that do not match the description of their operating structure.
56% of all herds are operated as owner-operators
57% of all sharemilkers are 50/50 sharemilkers
The number of herds farmed, average herd size, effective area and number of cows per hectare for each of the main operating
structures are shown in Table 3.5. In 2022/23, 56% (5,959) of New Zealand dairy herds operated under owner-operators, 29% (3,100) operated under a sharemilking agreement and 13.5% operated under a contract milkers agrement. Fifty-seven percent (1,778) of all sharemilkers have 50/50 agreements.
Table 3.5: Herd analysis by operating structure in 2022/23
Operating structure
Number of herds
Percentage of herds
Average herd size
Average effective hectares
Average cows per effective hectare
Owner-operators
5,959
56.2
435
156
2.79
Contract milkers
1,429
13.5
461
160
2.92
Sharemilkers:
less than 20%
117
1.1
721
226
3.14
20-29%
485
4.6
504
175
2.93
30-49%
140
1.3
417
142
2.86
50/50
1,778
16.8
402
142
2.87
over 50%
580
5.5
461
164
2.89
All sharemilkers
3,100
29.3
501
170
2.95
Other/Unknown
113
1.1
500
187
2.73
All farms
10,601
100.0
441
157
2.84
Herd production in each of the main operating structure groups is shown in Table 3.6. The table shows that, on average, sharemilkers on agreements of less than 20% continue to have the highest production.
Table 3.6: Herd production analysis by operating structure in 2022/23
Operating structure
Average litres per herd
Average kg milkfat per herd
Average kg milksolids per herd
Average kg milkfat per effective hectare
Average kg milksolids per effective hectare
Average kg milkfat per cow
Average kg milksolids per cow
Owner-operators
1,894,699
95,694
170,992
608
1,085
216
384
Contract Milkers
2,113,123
107,639
191,879
683
1,216
233
415
Sharemilkers:
less than 20%
3,387,530
171,855
309,068
750
1,348
237
426
20-29%
2,222,417
112,910
201,975
653
1,165
222
395
30-49%
1,739,699
88,848
158,212
598
1,061
207
368
50/50
1,784,853
91,283
162,486
646
1,148
224
398
over 50%
2,134,973
107,898
193,136
663
1,185
230
411
All Sharemilkers
2,261,764
114,971
205,725
664
1,185
225
401
All farms
1,952,790
98,966
176,683
631
1,125
221
393
Changes to the operating structure in the last ten seasons have seen the percentage of sharemilkers decrease overall, from 34.2% in 2013/14 to 29.3% of herds in 2022/23. Table 3.7 shows the percentage of herds in each operating structure type, whereas Table 3.8 gives the actual number of herds. For the last five seasons, the percentage of herds with contract milkers is shown separately. Prior to this they were included in the Owner-operator category.
Table 3.7: Trend in the percentage of herds in each operating structure for the last 10 seasons
Operating structure
2013/14
2014/15
2015/16
2016/17
2017/18
2018/19
2019/20
2020/21
2021/22
2022/23
Owner-operators
65.5
67.3
69.8
72.4
59.9
57.2
56.1
56.2
56.0
56.2
Contract Milkers
12.4
12.8
14.3
14.4
14.5
13.5
Sharemilkers:
less than 20%
1.7
1.5
1.3
1.1
1.1
1.2
1.3
1.1
1.1
1.1
20-29%
9.7
8.8
6.9
5.0
5.1
5.2
5.5
4.8
4.5
4.6
30-49%
1.5
1.4
1.5
1.3
1.4
1.4
1.4
1.3
1.4
1.3
50/50
18.5
17.1
16.8
16.4
15.9
16.9
16.6
16.6
16.8
16.8
over 50%
2.9
3.6
3.5
3.5
3.7
4.6
4.0
4.7
4.8
5.5
All sharemilkers
34.2
32.4
30.0
27.3
27.3
29.3
28.9
28.5
28.6
29.3
Other/Unknown
0.3
0.3
0.3
0.3
0.4
0.7
0.8
0.8
0.9
1.1
Table 3.8: Trend in the number of herds in each operating structure for the last 10 seasons
Operating structure
2013/14
2014/15
2015/16
2016/17
2017/18
2018/19
2019/20
2020/21
2021/22
2022/23
Owner-operators
7,812
8,059
8,315
8,503
6,940
6,507
6,268
6,206
6,046
5,959
Contract Milkers
1,440
1,460
1,597
1,594
1,568
1,429
Sharemilkers:
less than 20%
206
179
153
134
122
138
148
117
115
117
20-29%
1,151
1,050
821
586
595
589
616
534
489
485
30-49%
177
171
174
157
161
159
159
148
149
140
50/50
2,201
2,050
2,001
1,925
1,848
1,919
1,857
1,831
1,817
1,778
over 50%
346
429
421
406
433
526
447
515
517
580
All sharemilkers
4,081
3,879
3,570
3,208
3,159
3,331
3,227
3,145
3,089
3,100
Other/Unknown
34
32
33
37
51
74
87
89
93
113
Total
11,927
11,970
11,918
11,748
11,590
11,372
11,179
11,034
10,796
10,601
Table 3.9 compares the number (and percentage) of owner-operators with sharemilkers by region in 2022/23. In the South Island there were more variable order sharemilkers than 50/50 sharemilkers, while the opposite was the case in the North Island.
Table 3.9: Operating structure by region in 2022/23
Region
Owner operators
Owner operators %
Contract milkers
Contract milkers %
All share milkers
All share milkers %
50/50 share milkers
50/50 share milkers %
Variable order share milkers
Variable order share milkers %
Total herds (excl. unknown)
Total herds (excl. unknown) %
Northland
442
7.4
80
5.6
171
5.5
112
6.3
59
4.5
693
6.6
Auckland
161
2.7
35
2.4
104
3.4
67
3.8
37
2.8
300
2.9
Waikato
1,512
25.4
486
34.0
993
32.0
697
39.2
296
22.4
2,991
28.5
Bay of Plenty
270
4.5
72
5.0
127
4.1
78
4.4
49
3.7
469
4.5
Central Plateau
272
4.6
68
4.8
115
3.7
77
4.3
38
2.9
455
4.3
Western Uplands
44
0.7
9
0.6
32
1.0
16
0.9
16
1.2
85
0.8
East Coast
6
0.1
2
0.1
1
0.0
0
0.0
1
0.1
9
0.1
Hawkes Bay
48
0.8
6
0.4
10
0.3
8
0.4
2
0.2
64
0.6
Taranaki
820
13.8
205
14.3
453
14.6
253
14.2
200
15.1
1,478
14.1
Manawatu
320
5.4
61
4.3
101
3.3
53
3.0
48
3.6
482
4.6
Wairarapa
215
3.6
65
4.5
86
2.8
48
2.7
38
2.9
366
3.5
North Island
4,110
69.0
1,089
76.2
2,193
70.7
1,409
79.2
784
59.3
7,392
70.5
Nelson / Marlborough
134
2.2
17
1.2
39
1.3
21
1.2
18
1.4
190
1.8
West Coast
261
4.4
18
1.3
72
2.3
32
1.8
40
3.0
351
3.3
North Canterbury
510
8.6
110
7.7
257
8.3
87
4.9
170
12.9
877
8.4
South Canterbury
191
3.2
18
1.3
104
3.4
30
1.7
74
5.6
313
3.0
Otago
237
4.0
39
2.7
141
4.5
55
3.1
86
6.5
417
4.0
Southland
516
8.7
138
9.7
294
9.5
144
8.1
150
11.3
948
9.0
South Island
1,849
31.0
340
23.8
907
29.3
369
20.8
538
40.7
3,096
29.5
New Zealand
5,959
100.0
1,429
100.0
3,100
100.0
1,778
100.0
1,322
100.0
10,488
100.0
The number and percentage of owner-operators, contract milkers and sharemilkers by herd size is shown in Table 3.10. Herds in the range of 200-249 animals (which represent 12.7% of herds nationally) account for the highest percentage of herds in each known operating structure category. Owner-operators of herds with a size of 200-249 were the most common combination of operating structure and herdsize, with 777 herds.
Table 3.10: Operating structure by herd size in 2022/23
Herd size
Owner operators
Owner operators %
Contract milkers
Contract milkers %
All share milkers
All share milkers %
50/50 share milkers
50/50 share milkers %
Variable order share milkers
Variable order share milkers %
Total herds (excl. unknown)
Total herds (excl. unknown) %
10-49
9
0.2
1
0.1
1
0.0
0
0.0
1
0.1
11
0.1
50-99
89
1.5
3
0.2
10
0.3
6
0.3
4
0.3
102
1.0
100-149
338
5.7
17
1.2
89
2.9
44
2.5
45
3.4
444
4.2
150-199
627
10.5
69
4.8
281
9.1
174
9.8
107
8.1
977
9.3
200-249
777
13.0
182
12.7
376
12.1
247
13.9
129
9.8
1,335
12.7
250-299
575
9.6
162
11.3
334
10.8
224
12.6
110
8.3
1,071
10.2
300-349
544
9.1
157
11.0
350
11.3
218
12.3
132
10.0
1,051
10.0
350-399
425
7.1
126
8.8
251
8.1
156
8.8
95
7.2
802
7.6
400-449
411
6.9
121
8.5
241
7.8
148
8.3
93
7.0
773
7.4
450-499
308
5.2
81
5.7
170
5.5
84
4.7
86
6.5
559
5.3
500-549
273
4.6
101
7.1
163
5.3
104
5.8
59
4.5
537
5.1
550-599
225
3.8
71
5.0
126
4.1
72
4.0
54
4.1
422
4.0
600-649
219
3.7
69
4.8
136
4.4
75
4.2
61
4.6
424
4.0
650-699
156
2.6
46
3.2
96
3.1
44
2.5
52
3.9
298
2.8
700-749
129
2.2
42
2.9
72
2.3
25
1.4
47
3.6
243
2.3
750-799
125
2.1
26
1.8
67
2.2
34
1.9
33
2.5
218
2.1
800-849
123
2.1
23
1.6
74
2.4
29
1.6
45
3.4
220
2.1
850-899
91
1.5
28
2.0
46
1.5
21
1.2
25
1.9
165
1.6
900-949
93
1.6
18
1.3
46
1.5
18
1.0
28
2.1
157
1.5
950-999
73
1.2
16
1.1
36
1.2
14
0.8
22
1.7
125
1.2
1000-1099
109
1.8
24
1.7
51
1.6
19
1.1
32
2.4
184
1.8
1100-1199
80
1.3
20
1.4
30
1.0
9
0.5
21
1.6
130
1.2
1200-1499
112
1.9
20
1.4
34
1.1
9
0.5
25
1.9
166
1.6
1500+
48
0.8
6
0.4
20
0.6
4
0.2
16
1.2
74
0.7
Total/Avg
5,959
100.0
1,429
100.0
3,100
100.0
1,778
100.0
1,322
100.0
10,488
100.0
3.4 Breed breakdown
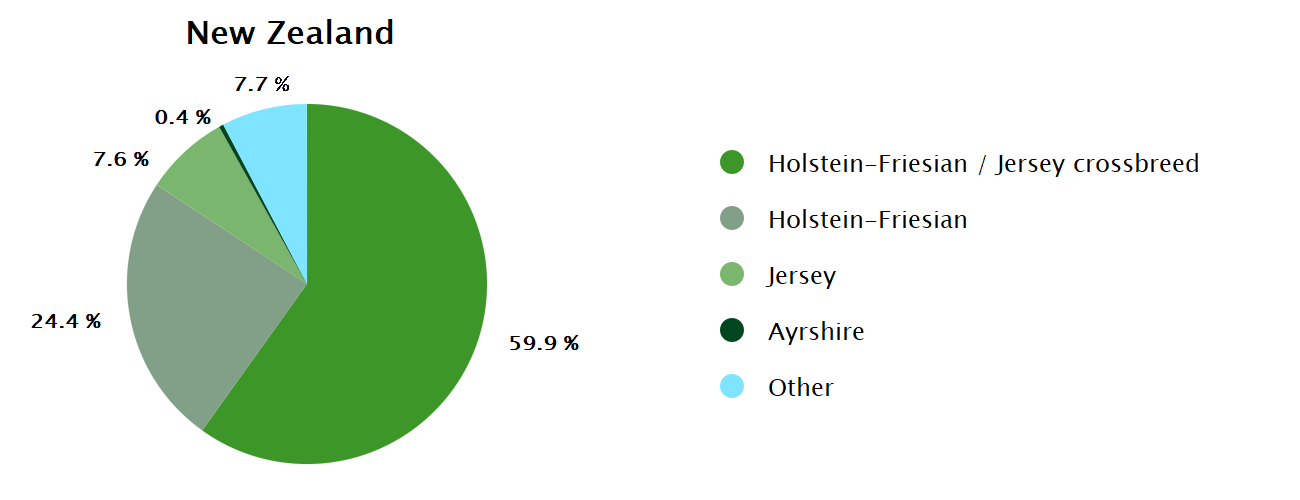
Three breeds of dairy cattle dominate the dairy cow inseminations carried out in New Zealand: Holstein-Friesian, Jersey, and Holstein-Friesian/Jersey crossbreed. Historically, these insemination counts have been pulled from the LIC National Database. From the 2021/22 season onwards, counts are based on records in the Dairy Industry Good Animal Database (DIGAD, https://www.dairynz.co.nz/animal/animal-evaluation/animal-database/). Breed categorisation has also changed to now match the Animal Evaluation (AE) breed classification used by New Zealand Animal Evaluation Limited (NZAEL).
The Jersey breed dominated the national dairy herd until the late 1960s. By 1970, Holstein-Friesian was the dominant dairy breed in New Zealand, because of changes in farm management practices. Holstein-Friesian/Jersey Crossbreed now makes up the largest proportion of the national dairy herd.
The percentages of the major dairy breed categories for New Zealand and each region are shown in Graphs 3.2 and 3.3. Percentages are given for Holstein-Friesian, Jersey, Holstein-Friesian/Jersey Crossbreed and Ayrshire cows, with the remaining breeds and crossbreeds grouped into “Other”. Holstein-Friesian/Jersey crossbreed is the prevalent breed category in all regions. The Hawkes Bay/Manawatu/Wairarapa region continues to have the highest percentage of Holstein-Friesian cows (35.6%) followed by Northland/Auckland (30.5%). West Coast/Nelson/Marlborough has the highest proportion of Jerseys (13%) followed by Northland/Auckland and Waikato/Western Upland (11.5% each). Marlborough/Canterbury has the highest proportion of Holstein-Friesian/Jersey Crossbreeds (66.5%), followed by Otago/Southland (64.3%).
Graph 3.2: Breed category percentages of cows for New Zealand in 2022/23
Graph 3.3: Breed category percentages of cows by region in 2022/23