2 Survey Description
2.1 Survey Methodology
Groups of farms were selected to match the average regional herd size, hectares and milksolids production as published in the New Zealand Dairy Statistics 2022-23 as close as possible while maintaining a large sample size. The initial pool of farms included 811 owner-operators and 238 50:50 sharemilkers (herd-owning sharemilkers) with data validated and committed to the DairyBase® database for the 2022-23 financial year. Businesses were then excluded for the following reasons:
multiple herds operating under one business identity.
herds with fewer than 50 cows.
businesses with a significant change in the land area during the year (>10%).
extreme outlier data.
incomplete financial data.
The sample selection process aimed to align the regional and national average herd sizes, hectares and milksolids production for each of these two ownership structures while retaining a reasonable number of farm businesses. These regional and national averages are available in the 2022-23 New Zealand Dairy Statistics publication.
The final number of herds included in this survey comprised 266 owner-operators and 109 50:50 sharemilker herds. Of the owner-operator herds, 200 (75%) were North Island herds, and 66 (25%) were from the South Island. Of the sharemilker herds, 77 (71%) were from the North Island, and 32 (29%) were South Island herds.
2.2 Ownership Structure Definitions
An owner-operator receives 100 percent of the milk revenue and either owns, or leases, both the herd and the land. In contrast, a 50:50 sharemilker owns the herd but not the milking land and receives 50 percent of the milk revenue. Although the definition of sharemilkers used in this survey is 50:50, in practice, they may receive between 40 percent and 60 percent of the milk revenue. Herds with variable order sharemilkers, and farm owners with sharemilking arrangements, were not included in this survey.
2.3 Sample Unit
The data used in this survey reflects the total dairying enterprise of each business. Where businesses have multiple ownership types, such as partnerships and trusts, the accounts of all entities are consolidated and entered as one.
2.4 Survey Weights
All national averages in this report have been weighted by the regional proportion of herds reported in the 2022-23 New Zealand Dairy Statistics (Table 2.1). Simply averaging the regional data shown in this document does not produce the same national average. Weighting the data ensures that each region contributes a representative proportion to the national averages. The national averages for 50:50 sharemilkers are weighted by the regional proportion of sharemilkers.
2.5 Herd Size Distributions
The average owner-operator herd in the DairyNZ Economic Survey had 407 cows, 12 cows lower than in the 2021-22 season. In comparison to the 2022-23 New Zealand Dairy Statistics national average herd size of 435, the average DairyNZ Economic Survey farm had 28 fewer cows.
Graph 2.1 shows a comparison of the owner-operator herd distribution between the 2022-23 DairyNZ Economic Survey and the 2022-23 New Zealand Dairy Statistics. In general, the DairyNZ Economic Survey:
is over-represented by herds between 200 and 500 cows.
is under-represented by herds with less than 200 cows, and by herds with 700 cows or more.
The DairyNZ Economic Survey national average herd size for 50:50 sharemilkers of 437 cows is larger than the 402 cows recorded in the 2022-23 New Zealand Dairy Statistics.
As compared with the 2022-23 New Zealand Dairy Statistics (Graph 2.2), for 50:50 sharemilkers, the DairyNZ Economic Survey:
has no herds under 100 cows, herds between 900 and 1000 cows, and herds with more than 1,100 cows.
is over-represented by herds between 400 and 600 cows.
is under-represented by herds between 100 and 300 cows.
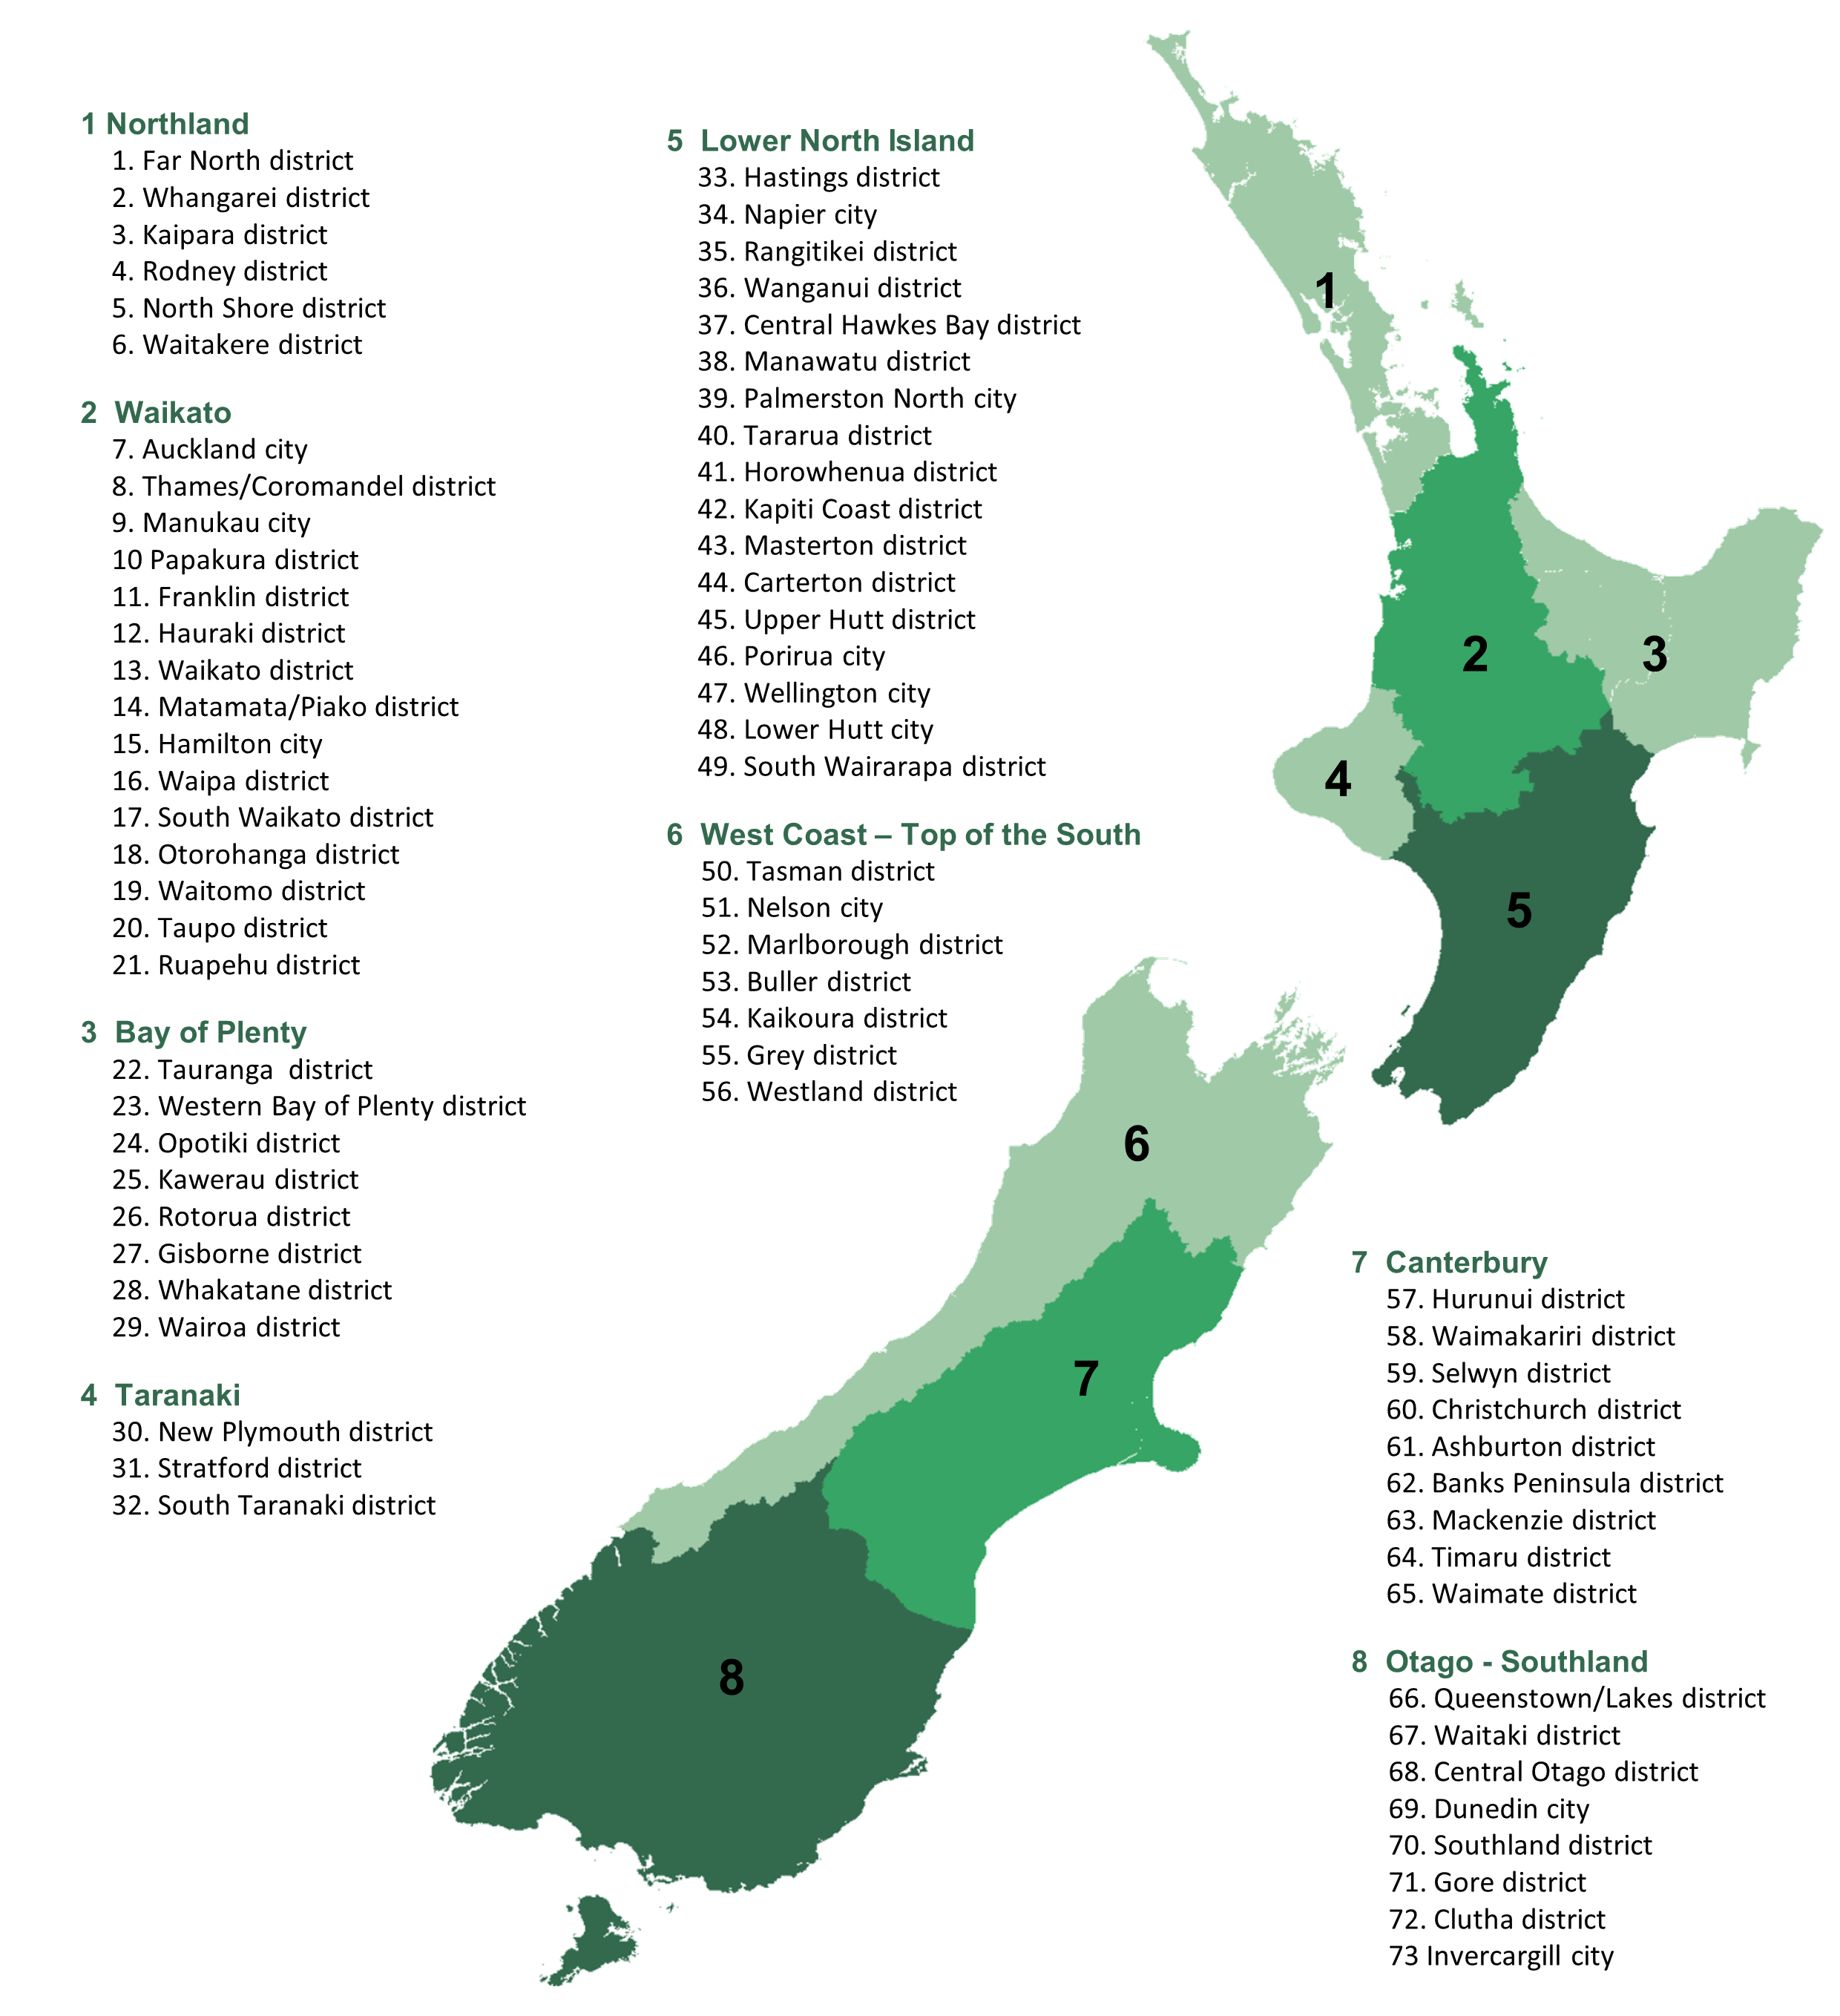
2.6 Survey Regions
This survey uses geographic districts as defined by the 73 Territorial Local Authorities (TLAs). These districts are amalgamated into eight regions, five in the North Island and three in the South Island. Regions 6 and 7, and the TLAs included in them were updated in the 2021-22 Dairy Economic Survey, to reflect similar changes in DairyBase®️. Since 2021-22, the Marlborough and Kaikoura districts were moved from the Marlborough - Canterbury region to the West Coast - Top of the South region. For regions 6 and 7, part of the differences between values before and after the 2021-22 season (sections 7.1 and 10.1) is due to the rearrangement of the TLAs that were part of them.
2.7 Production Systems
Farms are categorised into one of five production systems based on the timing, purpose and amount of imported feed used, both purchased as supplements and grazing off for dry cows. Young stock grazing policies are excluded when categorising herds into the five production systems described below.
System 1: All grass, self-contained, all adult stock on the dairy platform.
- No feed is imported. No supplement is fed unless harvested off the effective milking area, and dry cows are not grazed off the effective milking area.
System 2: Feed imported fed to dry cows (either supplement or grazing off).
- 90-99 percent of total feed is home grown feed. Variation in percentage as most cows are wintered off in high rainfall areas or cold climates.
System 3: Feed imported to extend lactation and for dry cows.
- 80-89 percent of total feed is home grown feed.
System 4: Feed imported and used at both ends of lactation and for dry cows.
- 70-79 percent of total feed is home grown feed.
System 5: Imported feed used all year.
- 50-69 percent of total feed is home grown feed, though it could be less than 50 percent in some cases.
This publication refers to low, medium, and high input systems. These are defined as:
Low: system 1 and system 2.
Medium: system 3.
High: system 4 and system 5.
2.8 Operating Profit Adjustments
Non-cash adjustments for resources used but not accounted for by cash income or expenditure are made when calculating the operating profit. A summary of these adjustments is shown below. For more detail, refer to the DairyBase® Operating Profit Adjustments and DairyBase® Livestock Values documents. An example of non-cash adjustments is the value of change in dairy livestock. This is the value due to a change in livestock numbers which is added or subtracted (if negative) to net dairy cash income to form gross farm revenue. This adjustment is made because the revenue from net dairy cash income can be affected by changes in herd size. For example, in drought years, more stock is sold and therefore, revenue through net livestock sales will be considerably higher. Similarly, livestock will be purchased in the years following a drought to increase numbers to a more normal level. The adjustment offsets these changes with a value for change in livestock on hand.
The operating profit adjustments include:
The value of change in dairy livestock. This is calculated as follows: closing livestock numbers less opening livestock numbers, valued at closing herd scheme values (Inland Revenue).
Labour adjustment. This has two components: unpaid management based on the size of the herd and time worked, and unpaid labour valued at an hourly market rate.
Feed inventory adjustment. This is estimated as closing supplementary feed on hand less opening supplementary feed on hand, valued at a standard 42 cents per kilogram of dry matter in 2022-23.
Owned support block adjustment. This value is based on the regional market lease rate per hectare.
Depreciation. This is the depreciation recorded in the annual financial statements of the farm.
2.9 Asset Values
DairyBase® calculates market values for land and buildings by using the most recent rateable valuations for each farm and adjusting these to 1 June 2022 and 1 June 2023 market values using sales data supplied by Quotable Value and REINZ, plus discussions with regional real estate agents and valuers. Opening and closing livestock values for each year are calculated using the Inland Revenue herd value scheme NAMV (National Average Market Values) for the appropriate age group of animals. Plant, machinery and vehicle values are recorded at book value. Off-farm assets and investments are shown as market values.
2.10 GST
The financial data is GST exclusive as these transactions are neutral to the farm operation.
2.11 Statistical Methodology
Multiple methodologies are used in the DairyNZ Economic Survey to generate statistics.
Tables and graphs that use time series data are generated using an average of sums methodology. The average of sums involves summing all values together. While per farm values will be equivalent to the arithmetic mean, values that are divided by the number of cows, hectares, and milksolids will report the average value divided by the average denominator.
The average of sums approach ensures that table entries add up to totals and sub-totals. However, a consequence of this methodology is that the averages reported are not equivalent to the arithmetic mean and can be biased depending on the data distribution. This bias can be severe in small samples, such as those used to produce the regional and production system tables. To circumvent issues of this kind, we now report the median of the data in the tables and graphs that are most at risk of showing such bias i.e. regional data. The median is the number that divides the data into two halves, such that half of the data is below, and half the data is above this value. It is a robust and unbiased representation of the centre of the data. In the affected tables, entries will no longer add up to totals and sub-totals but provide a more accurate and representative value for the data. For example, in Table 7.1, we can see that by adding milk sales (net of dairy levy), net livestock sales (sales - purchases) and other dairy cash income, they do not add up to net dairy cash income, in contrast to the equivalent table presented in the 2018-19 version of the DairyNZ Economic Survey.
The median is used in several different figures and tables:
In Figure 3.1, we use the median deviation from the 30-year median rainfall. We do this because the arithmetic average is not robust to severe weather events that may misrepresent the true average rainfall a region receives in a season.
In Tables 7.1, 7.2, 10.1 and 10.2, we report the median values for the table entries. Issues applying the average of sums methodology on these tables were identified in 2020. It was decided that accurate representation of these values was more important than ensuring the values added up in the table.